Introduction: A Strategic Imperative for a Digital Grid
Vietnam’s power sector is at a historic turning point, facing dual pressure: supplying energy to one of Asia’s fastest-growing economies while meeting the urgent demands of the global energy transition toward renewable sources.1 In this context, traditional management methods, which rely on fragmented data and manual processes, are showing clear limitations and can no longer cope with the growing complexity of the system. To ensure national energy security and support socio-economic development goals, modernizing the grid is no longer an option but a strategic imperative.
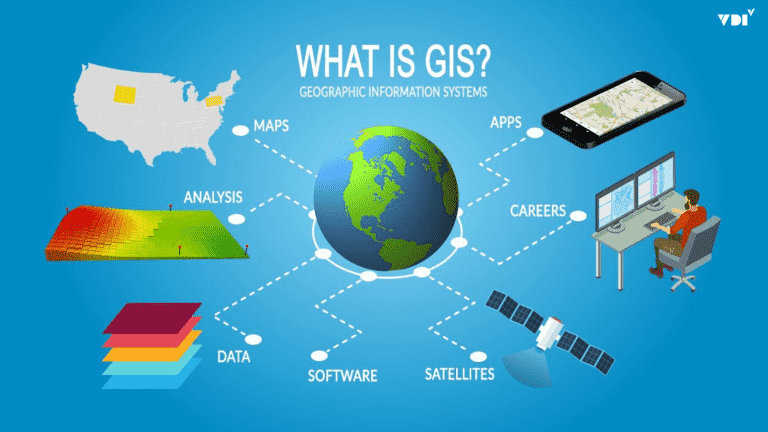
In this revolution, the Geographic Information System (GIS) has emerged not merely as a basic mapping tool but as a comprehensive digital platform that serves as the backbone for building a “Smart Grid.”3 By making geographic space a core element, GIS enables the power sector to shift from a reactive management model to a proactive, intelligent, and efficient system. This article takes an in-depth look at the challenges facing Vietnam’s power sector and shows that GIS is a comprehensive answer, from digitizing assets and optimizing real-time operations to long-term strategic planning.
Vietnam’s Power Sector Context: Challenges as a Driver of Transformation
To fully appreciate the strategic value of GIS, it is first necessary to understand the large, multifaceted challenges shaping the operating environment of Vietnam Electricity (EVN) and its member units. These challenges are not barriers; they are the strongest force driving digital transformation.
Complexity of the National Grid: Scale and Geography
Vietnam’s power grid is one of the most complex and extensive infrastructures in the country, stretching across diverse and rugged terrain. The scale of management goes beyond millions of kilometers of lines and millions of devices to include distinctive geographic factors. For example, Power Transmission Company No. 3 (PTC3) operates and manages about 5,200 km of transmission lines, including 2,000 km of 500kV lines, spanning 9 provinces in the Central region and Central Highlands, with winding mountain passes and harsh, unpredictable weather.4 Similarly, in remote areas such as Dien Bien, lines must cross many hills, dense forests, and streams, which creates many incident risks.6
This geographic complexity is not only a logistical challenge but also a factor that multiplies cost and risk. Every kilometer of line through rugged terrain is significantly more expensive to inspect, maintain, and repair than in urban areas. When an incident occurs on a 500kV line in the mountains, pinpointing its location and reaching the site with traditional manual methods can take days instead of hours. This not only raises operating expenses (OpEx) but also directly affects key power supply reliability indicators such as SAIDI (System Average Interruption Duration Index), causing damage to both the power sector and the economy. Clearly, reliance on paper maps and the personal experience of technical staff is no longer appropriate, creating an urgent need for a tool that can digitize and visualize the entire network on a single platform.7
The Problem of Power Losses and Cost Optimization
Vietnam Electricity (EVN) has made notable achievements in reducing power losses, from 12.23% in 2003 to 6.25% in 2022, bringing the rate close to that of developed countries.8 However, continuing to reduce this rate is an extremely large challenge. Power losses consist of two main components: technical losses (which occur naturally during transmission and distribution) and non-technical losses (caused by theft, metering errors, and management errors).8 Reducing power losses has deep economic significance, helping improve business performance and freeing up important capital to reinvest in upgrading and modernizing grid infrastructure.9
The initial successes in reducing losses came mainly from macro-level solutions and large-scale investment. However, the remaining losses, about 6%, lie deep in the micro-level problems of the system, such as local overloading of some transformers, phase imbalance, or errors in customer connections that conventional management systems struggle to detect. To tackle this “last percent,” the power sector cannot rely on scattered investments alone; it needs a highly precise approach, like “microsurgery.” It must identify exactly which areas and which devices are causing the largest losses so that interventions can be targeted correctly. For example, one cause of errors in loss calculations is that customers switch wire branches on their own, or survey staff record the wrong connection point, leaving customer data that does not match the actual grid.11 This is a problem that is inherently tied to geographic space, and it requires a system capable of analyzing and managing the grid visually and in detail down to each individual customer.
Safety Corridor Management and Investment Bottlenecks
Managing the safety corridors of high-voltage grids is a critical task, strictly regulated by law to protect people and property while keeping the system running stably.12 This work includes strictly controlling trees inside and outside the corridor and preventing construction that violates safety clearances.6 However, with such a vast network, manual monitoring becomes extremely costly and inefficient.
More seriously, problems in planning and investment are directly increasing risks to the existing grid. Many key grid projects are delayed because of obstacles in site clearance, in procedures for approving investment policies, and especially in discrepancies between local power supply network development plans and actual implementation.16 The causal link here is clear: when a new transmission line project is delayed, existing lines must carry a growing share of the load and operate at full or overloaded capacity for longer than expected. This not only increases technical losses but also creates physical risks, such as conductors sagging lower, raising the risk of flashovers and incidents, which makes safety corridor management more urgent and difficult than ever. Therefore, a bottleneck in strategic planning directly creates a hazard in day-to-day operations.
Pressure from New Load Demand and Renewable Energy
Vietnam’s grid faces a “dual challenge”: an explosion in electricity demand from the digital economy and an increasingly deep penetration of renewable energy sources.1 Data centers and artificial intelligence (AI) applications, a field forecast to contribute more than USD 130 billion to Vietnam’s economy by 2040, consume huge amounts of electricity and demand near-absolute stability and reliability.1 International investors in high technology care about the stability and supply of clean power even more than the price of electricity.1
At the same time, integrating intermittent renewable sources such as solar and wind into the system poses major challenges for dispatch and grid balancing.17 Load forecasting becomes more complex when the exact amount of rooftop solar capacity feeding into the system is unknown, leading to the risk of supply shortages at peak hours or surpluses during the day.20 This instability affects not only energy security but could also become a major barrier to attracting high-value foreign direct investment (FDI). The current grid, designed for one-way energy flow from large power plants to consumers, is not truly ready for a future with two-way energy flows and large, flexible loads. This elevates grid modernization from an EVN priority to a national strategic issue that determines the competitiveness of the economy in the digital era.
GIS: The Foundation for the Smart Grid
Faced with such complex challenges, GIS does not merely offer individual solutions but provides a unified platform that lets the power sector build a smart, comprehensive, and predictive management system.
Building a Digital Twin: Visualizing All Grid Assets
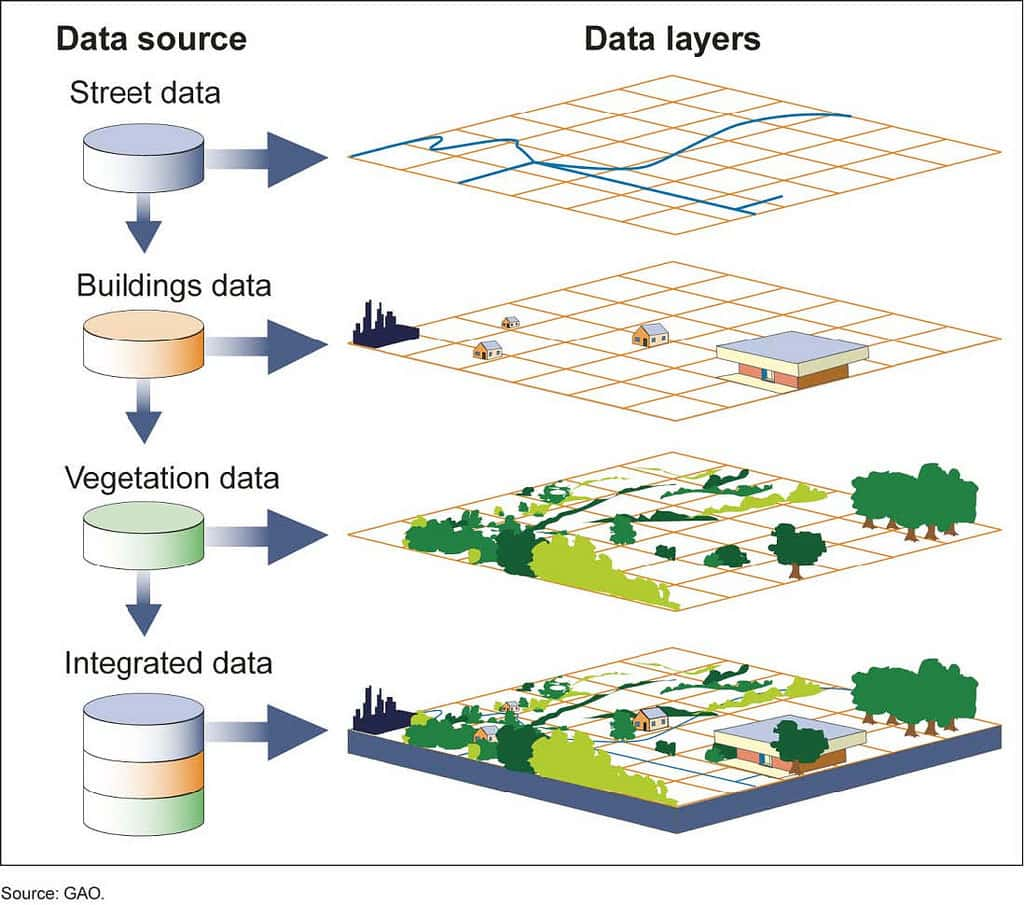
The concept of a “Digital Twin” is defined as a living virtual simulation of a physical system that uses real-time data to monitor, analyze, and optimize operations.3 In the power sector, the Digital Twin is regarded as the foundational technology of the Smart Grid.3 The foundation for building a grid Digital Twin is a detailed, comprehensive electrical connectivity model managed by GIS.22 GIS digitizes all of the grid’s physical assets, from 500kV substations and transmission lines down to every pole, distribution transformer, and customer meter, and then assigns each asset an accurate geographic location on the map.7
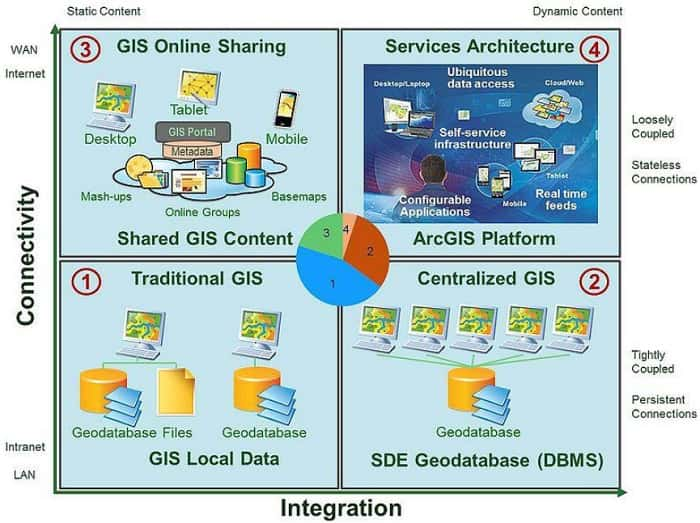
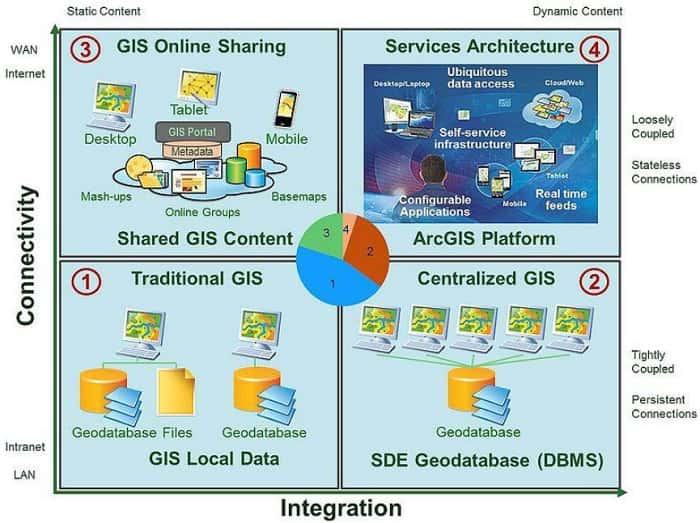
This creates a revolutionary change in the management paradigm. Instead of managing a collection of discrete assets recorded on drawings, spreadsheets, and standalone systems, the power sector will manage a single, comprehensive, and constantly updated digital ecosystem. GIS acts as the “glue,” integrating data from many different systems such as SCADA (supervisory control and data acquisition), ERP (enterprise resource planning), CMIS (customer management information system), and smart sensors into a “single source of truth.”3 A point on the GIS map representing a transformer can simultaneously link to its technical specifications (from the asset management system), its real-time load (from SCADA), its maintenance history (from the EAM system), and the list of customers it serves (from CMIS).22 Breaking down the data islands between departments (engineering, operations, business, customer care) makes enterprise-wide analyses possible, something that could not be done before. As a result, the power sector can move from a reactive “fix it when it breaks” operating model to a proactive one that relies on analysis and forecasting to prevent incidents before they happen.3
Optimizing Operations and Outage Response with an Outage Management System (OMS)
An Outage Management System (OMS) is specialized software that helps utilities detect, manage, and restore power outages efficiently.25 The real strength of a modern OMS lies in its deep integration with the GIS platform. GIS provides the OMS with its “brain”: a detailed and accurate network model that is the basis for every analysis and decision.25
When an incident occurs, the response process is automated and optimized to an exceptional degree. Instead of waiting for customer calls and guessing the fault location, the OMS simultaneously receives information from multiple sources: alarm signals from automated devices on the grid (SCADA), “last gasp” signals from smart meters, and customer outage calls recorded through the CIS system.25 Based on the grid model from GIS, the OMS traces the network, analyzes it, and pinpoints the device that caused the fault (for example, a blown fuse or a tripped circuit breaker). The system immediately displays the fault location on the map, generates a complete list of affected customers (including those who have not called), and sends the optimal route to the mobile device of the nearest repair crew.25 The whole process, which previously could take hours of manual diagnosis and coordination, is now shortened to just a few minutes.
The clearest proof of this effectiveness is the success story at Ho Chi Minh City Power Corporation (EVNHCMC). This unit developed its own OMS, which was recognized as a “Make by EVN” product.30 By integrating the OMS with SCADA and grid automation programs, EVNHCMC achieved dramatic improvements in reliability. The SAIFI index (average number of interruptions per customer per year) fell from 25.04 in 2011 to just 0.54 in 2021. Similarly, the SAIDI index (average outage duration per customer per year) dropped sharply from 3,433 minutes to just 41 minutes over the same period.30 These figures not only demonstrate operational benefits but are also convincing evidence of the return on investment (ROI) that GIS-OMS integration delivers.
Spatial Analysis: A Tool for Planning and Developing the Future Grid
Beyond improving day-to-day operational efficiency, GIS is also a powerful strategic analysis tool that helps the power sector plan and develop the grid in a smart and sustainable way.
Load Forecasting and Network Planning
Accurate load forecasting is the foundation of all effective grid planning.20 With EVN needing to prepare for high load growth scenarios of up to 14% per year, forecasts must be more detailed and accurate than ever.31 GIS makes this possible through spatial analysis. Planners can overlay current electricity consumption maps with other spatial datasets such as urban development plan maps, plans for new industrial zones, population growth data, and even real estate market trends.32
This approach allows a shift from reactive planning (building infrastructure after problems such as overloading have already appeared) to proactive, predictive planning. By simulating future load demand across geographic space, utilities can identify in advance which substations and which lines will face overload risks over the next 5-10 years. A typical example is EVNHCMC, which has been applying GIS to support power supply planning for new residential areas to meet fast-growing load.35 This approach keeps EVN one step ahead, planning investment strategically and ensuring that the grid develops in step with the economy, instead of always chasing after bottlenecks.
Selecting Optimal Locations for New Infrastructure
Vietnam’s national power development plan for 2021-2030 (Power Development Plan VIII) calls for huge investments in new generation facilities and transmission grids.36 Choosing the location of a new substation or the route of a 500kV line is a complex decision with major financial, environmental, and social impacts. GIS-based site selection analysis replaces intuitive, experience-based decisions with an objective, data-driven process.33
A GIS can integrate and analyze many different data layers at the same time: topographic maps (slope), land use status maps, prohibited or restricted construction areas (protection forests, conservation areas), distance to load centers, estimated site clearance costs, and accessibility for construction.32 By setting criteria and weights, the system can run “what-if” scenarios to compare the pros and cons of different options, producing a “heat map” that shows the most suitable areas. This process not only finds the optimal option technically and economically but also produces a transparent, scientifically grounded dossier that helps speed up the complex approval process mentioned earlier.16
Managing and Reducing Power Losses
GIS is an extremely effective tool for tackling power losses visually. Power losses are an “invisible” problem on reports, but GIS can make them “visible” on a map. By integrating consumption data from the CMIS system with the network model in GIS, a utility can create thematic maps that color areas, substations, or feeders according to their loss rates.11
This approach immediately draws managers’ attention to “hot spots,” places with abnormally high loss rates. Instead of applying scattered solutions, they can focus investigation and remediation resources on the problem areas. EVNHCMC has applied GIS very successfully in this area. When it needs to investigate a poorly performing area, GIS gives field teams a detailed map down to each customer and connection point, making it easy to spot abnormal connections or errors in the grid structure.11 Similarly, in “load splitting and transfer” work to deal with under-loaded or overloaded equipment, engineers can simulate changes directly in GIS and calculate the impact of load transfers in advance before implementing them in the field, ensuring the decision is optimal and minimizing risk.11
Strategic Vision and Implementation Roadmap for Vietnam’s Power Sector
Applying GIS in Vietnam’s power sector is no longer theoretical; it has been proven by concrete results at many units. The question now is how to systematize these successes into an overall strategy aimed at a smarter and more sustainable future.
From Pilot to Scale-Up: Lessons from EVN’s Successes
Many EVN member units have pioneered the use of GIS and achieved significant successes, creating valuable lessons for scaling up across the whole group. These examples are the clearest evidence that GIS is a flexible platform that delivers value across many operational areas, from high-voltage transmission to distribution and electricity business in large cities and rural areas.
| Unit | GIS Application Area | Key Results and Benefits | Source |
|---|---|---|---|
| EVNHCMC | GIS-OMS integration, power loss management, grid planning | • SAIFI reduced from 25.04 to 0.54; SAIDI from 3,433 to 41 minutes (2011-2021). • Accurately identified high-loss areas for treatment. • Supported power supply planning for newly developed areas. | 11 |
| EVNNPC | Digitization of the entire grid across 27 northern provinces | • Visual, accurate monitoring of all assets on the digital map. • Rapid response to incidents, shorter handling time. • Transparent, scientific asset management and optimized operations. | 7 |
| EVNSPC | Low-voltage grid management, customer care | • Built a database for managing the low-voltage grid. • Improved service quality: quickly locating customers who report incidents and providing timely information. • Increased efficiency of incident handling and service delivery in the field. | 38 |
| PTC3 (EVNNPT) | Transmission grid operation management | • Quickly locates incidents on complex, rugged terrain. • Delineates lightning-caused incident zones and optimizes inspections. • Digitized all inspection forms and improved data management efficiency. | 4 |
These successes show the enormous potential when GIS is deployed in a coordinated way. They not only solve specific operational problems but also lay the foundation for a more data-driven, transparent, and efficient management system.
A Call to Action: Toward a Unified, Smart Grid
The greatest potential of GIS will be unlocked only when EVN moves from isolated pilot projects at individual units to building a unified Enterprise GIS platform across the whole group. Such a strategy would create a “system of systems,” enabling cross-corporation analysis, optimizing power transmission between regions, and establishing common data standards. This would make it easier to integrate the technologies of the future, such as Artificial Intelligence (AI) and advanced grid analytics tools.
To realize this vision, the leaders of EVN and its member units need to take the lead and define GIS not as a mere information technology project but as a long-term strategic investment in the future of the sector. The implementation roadmap should include concrete steps: developing an overall GIS strategy for the whole group, investing in data standardization and cleansing, and, most importantly, fostering a culture of data-driven decision-making throughout the organization. This is the inevitable path to building a national grid that is not only strong and efficient but also smart and flexible enough to become a solid driver of Vietnam’s economic development in the decades ahead.
References
- What is EVN doing to quench the “energy thirst” of AI and data centers? – VietNamNet. View source
- The power sector faces many challenges – Tien Phong. View source
- Digital Twin of the Distribution Grid – Envelio. View source
- Benefits of applying GIS technology in grid operation management – Cong Thuong. View source
- Benefits of applying GIS technology in grid operation management – EVNNPT. View source
- Dien Bien Power Company ensures the safety of high-voltage grid corridors, promotes communication and raises public awareness. View source
- The “red big brother” of the power sector: EVNNPC applies technology to change how the power network is managed and operated – eKGIS. View source
- Challenges in reducing power losses on Vietnam’s grid – EVN. View source
- Is there still room to reduce power losses? – VNEEP. View source
- EVN NPT’s “cost optimization” solutions – Vietnam Energy Magazine. View source
- Ho Chi Minh City Power Corporation: Applying GIS in power loss management – EVN. View source
- New regulations on grid safety corridors (220 kV, 500 kV) – Luat Minh Khue. View source
- Decree 14/2014/ND-CP detailing the implementation of the Electricity Law on electrical safety. View source
- Detailed information on grid safety corridor regulations – Vankhinen THP. View source
- Electric Utilities – GIS Cloud. View source
- Project investment status, fuel issues, power supply risks, and EVN’s proposed solutions. View source
- Many obstacles in power source development – Bao Dau Tu. View source
- Site clearance for transmission grid projects: Difficulties, lessons learned, and solutions to speed up progress. View source
- The power system operates under strain, and power supply faces many difficulties. View source
- What does EVN say in response to criticism of “making things difficult” for people installing rooftop solar? – VTC News (YouTube). View source
- A digital twin model based on knowledge graphs – ICT Vietnam. View source
- Geographic Information Systems – GIS Software for Utilities – Milsoft Utility Solutions. View source
- Applying GIS technology at EVN. View source
- What is a Digital Twin? – GE Vernova. View source
- Outage management system – Wikipedia. View source
- Digital twins: Revolutionizing the operational challenges of data centers. View source
- What are Outage Management Systems (OMS)? – Awesense Blog. View source
- Outage Management System (OMS) – Powercom. View source
- What is Outage Management Information System? – IPS Energy. View source
- The outage management program OMS is recognized as a “Make by EVN” product – VOV. View source
- Electricity load may grow 14%, EVN ready to respond – Bao Moi. View source
- VertiGIS Neo Solutions – Utilities. View source
- What is a GIS system? Top 5 benefits of a GIS system – eKMap. View source
- EVN NLDC – eKMap. View source
- Applying GIS in the power sector in Vietnam – GIS Technical Corner. View source
- Full text: Power Development Plan VIII – Policy and Law Development. View source
- Building a grid management system on maps (GIS) – Bnews. View source
- Southern Power Corporation: Modernizing the power supply system – EVN. View source
Sources accessed on September 23, 2025.