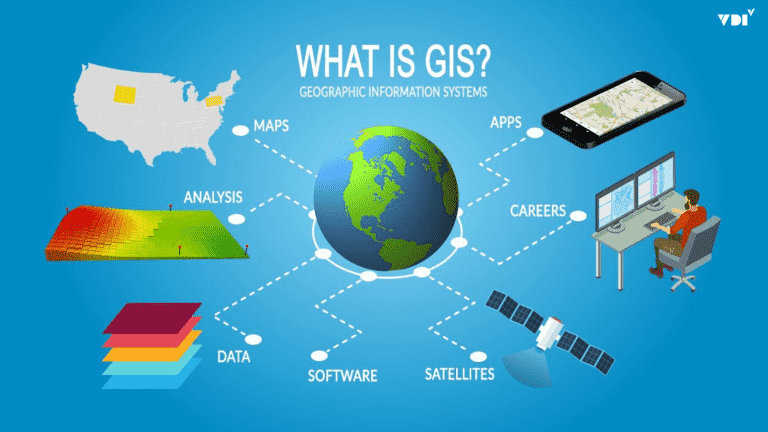
Vietnam is one of the countries most severely affected by climate change. The frequency and intensity of disasters such as storms, floods, flash floods, and landslides keep rising, causing enormous loss of life and property. In this context, shifting from a reactive, experience-based approach to a proactive one driven by data and technology is a matter of survival. Geographic Information Systems (GIS) are the core technology, acting as the “brain” of a modern digital command center, improving effectiveness at every stage of disaster management.
Challenges in the Era of Climate Change
Disaster prevention and control (DPC) today faces very large challenges:
- Complexity and unpredictability: Disasters are becoming more extreme and irregular. A single storm can cause heavy rain, leading to widespread flooding and triggering landslides in mountainous areas. Accurately forecasting the extent of impact of this chain of disasters is extremely difficult.
- Fragmented data: Information from meteorological and hydrological stations, population data, infrastructure data, and more is often managed separately. When a disaster strikes, the lack of a unified overall picture makes decision-making slow and imprecise.
- Inefficient resource coordination: Deciding which areas to evacuate first, which routes are safe for rescue forces to reach, or which supply depot is nearest often relies heavily on experience, risking overlooked critical areas or suboptimal resource allocation.
How Does GIS Solve These Problems?
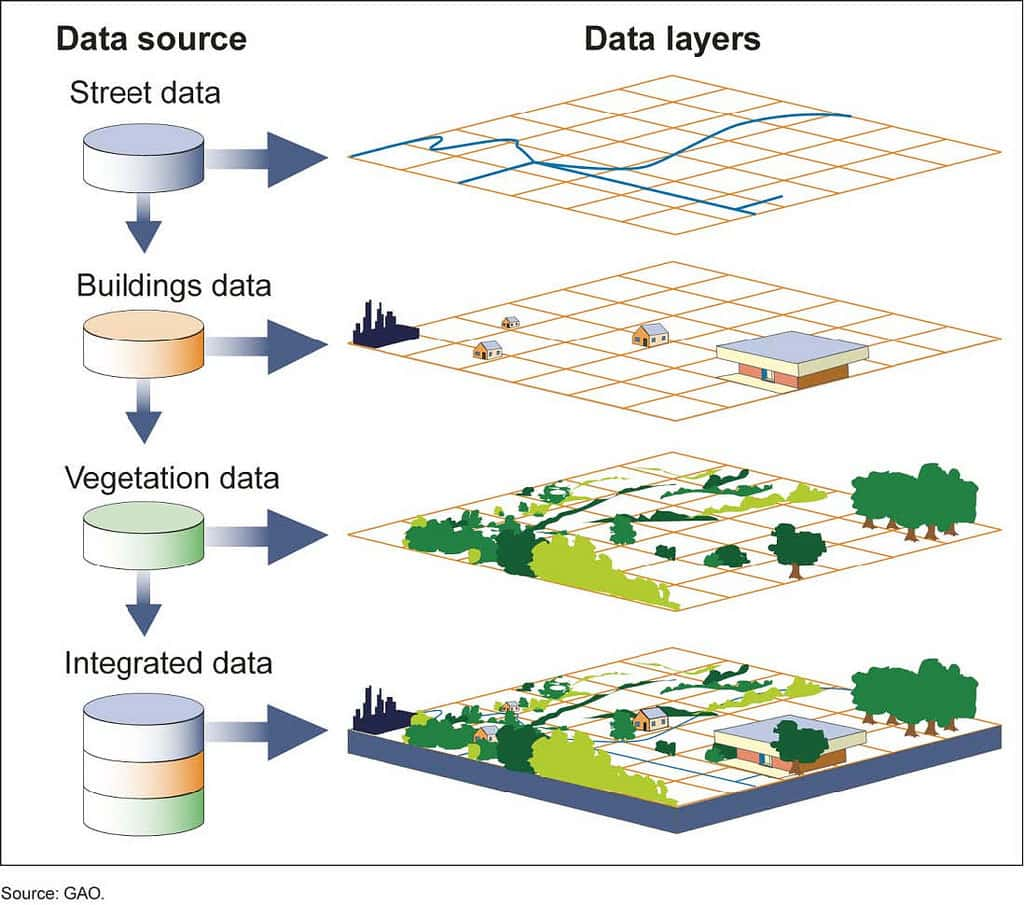
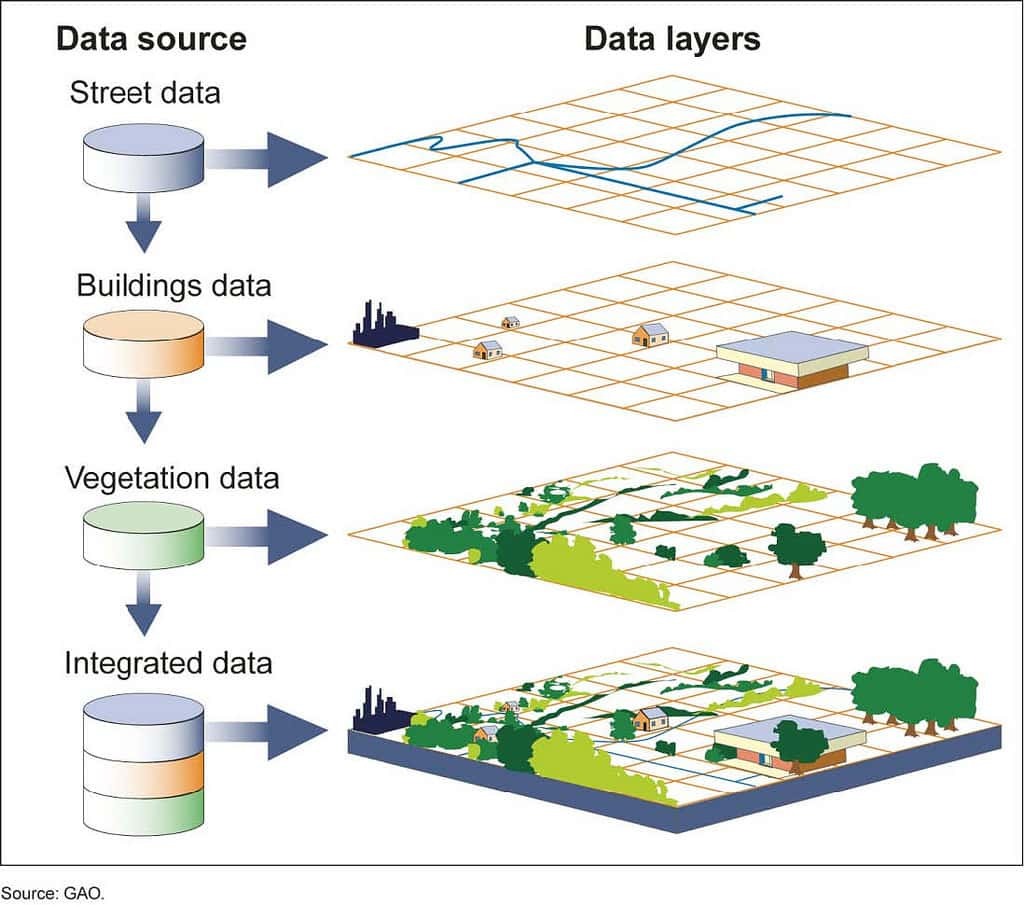
GIS provides a spatial platform to integrate, analyze, and visualize all types of disaster-related data, turning scattered information into knowledge that supports decision-making.
1. The “Before the Disaster” Stage: Building Disaster Risk Maps
This is the strategic step that shifts the approach from reactive to proactive. GIS makes it possible to build early-warning maps by overlaying and analyzing different spatial datasets:
- Flood risk maps: Built by combining a digital elevation model (DEM) with rainfall and river water level scenarios. The system can simulate and precisely delineate the areas that will be flooded at different levels (for example, flooding of 0.5 m, 1 m, and 2 m).
- Landslide risk maps: GIS analyzes the factors that cause landslides, such as slope, geology, vegetation cover, and rainfall, to identify hillsides and areas at high risk of sliding.
When these hazard maps are overlaid with maps of population distribution and critical infrastructure (schools, hospitals, factories), we obtain a Disaster Risk Map, which clearly identifies the most vulnerable areas so that protective works and detailed response plans can be prioritized.
2. The “During the Disaster” Stage: Integrating Real-Time Monitoring Data
When a disaster begins, GIS becomes a visual command center:
- Visualizing storm and flood developments: Data from weather radar, satellite imagery, rain gauges, and automatic water level stations is connected and displayed directly on the map in real time. The command board can visually track the storm’s path, heavy rain zones, and flood water levels on rivers, instead of just reading numbers in reports.
- Creating a shared situational picture: GIS integrates all information onto a single map, giving leaders a comprehensive view (Common Operational Picture) and allowing them to grasp, at the same time, how the disaster is developing and the status of the affected residential areas and infrastructure.
3. The “Response” Stage: Supporting Optimal Decision-Making
This is when the analytical power of GIS is most fully realized:
- Simulating evacuation scenarios: Based on the forecast flood map, GIS can automatically identify the households that need to evacuate. More importantly, the Network Analyst tool finds the safest and fastest travel route from danger zones to pre-designated safe shelters.
- Coordinating rescue forces and supplies: When a rescue call comes in, the system can locate the nearest rescue team and guide it along the optimal route, avoiding areas that are cut off. GIS also helps manage the locations of reserve supply depots (food, medicine), enabling quick and sensible dispatch to affected areas.
- Rapid damage assessment: Right after a disaster passes, using GIS together with drone imagery or high-resolution satellite imagery helps quickly delineate affected areas and roughly estimate the area of damaged crops and the number of damaged houses, providing a basis for recovery efforts and support to residents.
Conclusion: Toward a Smart Disaster Management System
As disasters grow more severe, applying GIS is no longer an option but an urgent requirement. GIS acts as a “digital command center”, providing the ability to “see far and wide” through risk maps, the ability to “see through” the situation by integrating real-time data, and the ability to “act precisely” through decision-support tools.
Investing in GIS is investing in the safety of the people and the sustainable development of the country.
Are the Vietnam Disaster and Dyke Management Authority and the Committees for Disaster Prevention, Search and Rescue at all levels looking for a breakthrough technology solution to improve command and operations capability and reduce disaster damage?
Contact UNIGIS. We are ready to work with you to build and deploy specialized GIS systems that support timely and accurate decisions in every situation.